Work Plan
Onboarding
Kick-off meeting — August 28, 2026
| Attendee | Role | Institution |
|---|---|---|
| Yu Peng | Postdoc, project lead | ESIIL |
| Cibele Amaral | Project supervisor | ESIIL |
| Timothy Bowles | Academic mentor | UC Berkeley |
| Lixin Wang | Advisory expert | IU Indianapolis |
- Introductions and roles → Project Members
- Roadmap set around the four research objectives
- Notes:
templates/meeting-notes/in the repository
Active Research
| Workstream | Objective | Repo | Status |
|---|---|---|---|
| Automated ground-truth labels | 1 — LLM synthesis of Cover Crop and Tillage Transect Reports, on-farm and literature records | LLM_AutoExtracting_CC | Pipeline built; first end-to-end run next |
| HLS × ECOSTRESS fusion | 2 — sensor harmonization | firerx_ml_CC · notebook | Pilot cube + phenology layers done (Progress 2) |
| On-farm report screening | 1 — labels, tier 2 | — | PFI, NE OFRN, Ohio triaged; field geolocation running |
| Ground-truth pilot, 3 sites | 1 + 3 — label test of the layers | firerx_ml_CC | Running (Progress 3–4); results below |
| Detector v11 | 3 — phenology retrieval | firerx_ml_CC | Route defined; lidar probe first |
- Compute: CyVerse (JupyterLab, VS Code); NASA Earthdata via
earthaccess; Claude models via CyVerse AI-VERDE - Storage: CyVerse Data Store
CoverCrop_Fusion/(fused cube, caches, figures) - Blocker: labels. The Indiana pilot has 12 field-seasons; the greenness threshold is provisional until the Cover Crop and Tillage Transect Reports and tier-2 fields are available
Technical route (v11)
The route below is the plan. Results already in hand are logged under Progress 3–4; Progress 1–2 stay as first reported. Newer entries are added at the bottom.
v8–v10 (optical + land surface temperature + Ma et al. baseline + climate, Indiana pilot) showed that with two fields every fixed field attribute over-fits. v11 therefore expands labels first and adds Sentinel-1 features second.
| Stage | Work | Pass criterion | Time |
|---|---|---|---|
| 0. Lidar probe | Find 3DEP flight dates for the two Indiana fields; compute above-ground return fractions and first-return intensity (1064 nm) | Flight date 15 Mar–20 May, and cover-crop vs control difference larger than within-field variation; otherwise drop lidar | 1–2 days |
| 1. Lidar label library | Indiana CSB fields with flights in that window and corn/soy CDL; label green cover / bare-residue / uncertain, checked against HLS NDVI within ±5 days | Winter wheat scores as green; county positive share matches Census in magnitude | 1–2 weeks |
| 2. v11 model | v10 seasonal table + Sentinel-1 VH and coherence by month (6-day revisit restored after Sentinel-1C); random forest. Train on lidar labels, tier 1–2 fields and transect points; validate on withheld transect-report counties and years | Sentinel-1 fills the late-November-seeding gap; Ma et al. 144 features still beat v8 layers at scale | 2–3 weeks |
| 3. County proportions | Add county cover-crop area (Census 2017, 2022; excludes CRP) as a proportion loss; compare with OpTIS | Extrapolates to non-Census years | 2–4 weeks, parallel with 2 |
| 4. Nitrogen layer (optional) | Red-edge ΔRE on detected fields, calibrated to Thieme et al. 2025 (kg N/ha) | Relative values only until local biomass sampling exists | — |
Validation protocol (all stages). Unit = CSB field-season, not pixel. Splits: leave-one-year-out and source × region blocks. Report recall by detectability class and producer's and user's accuracy separately; report the IN paired test (cover crop − control, sign test) as the mechanism check.
Not doing. GEDI/ICESat-2 canopy height, global canopy-height products, NEON-style canopy N:P:K, and further feature work on two fields.
Risks. 3DEP ground classification may absorb low vegetation (fall back to intensity only); one flight per field means labels are tied to the flight year; Census cover-crop definitions differ by state.
Progress 1 · Automated Extraction of Field Ground-Truth Labels
Goal — synthesize labelled fields (where · when · which species · which cash crop) from the Cover Crop and Tillage Transect Reports, extension on-farm research reports (PFI, NE OFRN, Ohio) and published field studies, for training and validating the v11 detector. Published studies are the first test corpus because their answers can be checked.
Pipeline (one report or record in → rows out)
| Step | What happens | Who does it |
|---|---|---|
| 1. Parse | PDF → Markdown; locate Methods and Results | code |
| 2. Block 1 | Location, species, cash crop, planting/termination dates from Methods | regex + gazetteer; LLM only for leftovers |
| 3. Block 2 | Classify response types (yield / GHG / SOC / N); pull values from text, tables, or figure-referenced charts | LLM (vision only when figure-referenced) |
| 4. Normalize | Controlled vocabularies; response ratios | pure math, never LLM |
| 5. Validate | Species → GBIF / WFO; coordinates → GeoNames | external APIs |
| 6. Emit | One row per (treatment × species × year × response), each field tagged high / medium / low confidence with source note; never fabricates | code |
- Built on ESIIL's LLM_lesson_exemplar agentic-repo pattern (
AGENTS.md, run log) - Model calls go through an OpenAI-compatible API → portable across providers
Label schema
| Design choice | Decision |
|---|---|
| One row | (site, field/plot, cover-crop season, treatment) |
| Negatives | No-cover-crop control plots kept as explicit negatives |
| Season key | cc_season = cover crop termination year |
| Required fields | location · CC year and period on the surface · species / type (legume vs. non-legume, interseeded) · cash crop with planting / harvest dates · biomass when available |
| Spatial confidence | Tiered — most records are small plots < 30 m pixel with CC / control adjacent |
| Coordinate QC | Doubtful coordinates re-checked against multiple sources |
- Seed data: hand-built GHG table (295 records / 40 papers) + yield table (1,026 records / 91 papers)
Status & next
- ✅ Scaffold, schema (GHG in long format), gazetteer, validation, model-calling stages, multi-row extraction, CLI runner, tests passing
- ⬜ First end-to-end run on one paper → field-by-field review
- ⬜ Batch the ~94-paper corpus (auto-download open access; list paywalled for manual retrieval)
- ⬜ Apply the same pipeline to extension on-farm reports (tier 2: PFI, NE OFRN, Ohio) — screening in Active Research
- ⬜ Map transect points to the label schema once the data agreement with the Indiana State Department of Agriculture is in place (tier 3)
- ⬜ Merge with hand-built tables → publish labelled dataset with confidence tiers
- ⬜ Use labels to tune the greenness threshold in Progress 2
Progress 2 · HLS × ECOSTRESS Fusion Pilot
Setup
| Item | Value |
|---|---|
| ROI | 10 × 10 km near Purdue ACRE farm, West Lafayette, IN (−86.995°, 40.482°; UTM 16N) |
| Period | Sep 2024 – Oct 2025 · 27 × 16-day windows |
| Cropland mask | USDA CDL corn + soybean · 54% of ROI |
| Source | Product | Variable | Resolution |
|---|---|---|---|
| NASA HLS (Landsat 8/9 + Sentinel-2) | HLSL30 / HLSS30 v2.0 | NDVI, NDTI (Fmask-masked) | 30 m |
| NASA ECOSTRESS | ECO_L3T_JET | Daily ET (QC-masked) | 70 m |
| USDA NASS | Cropland Data Layer | Corn / soybean mask | 30 m |
Fused cube
- 116 HLS observation days → 16-day composites (NDVI median, ET mean) → per-pixel linear gap-fill
- Grids derived from the ROI polygon, so 30 m and 70 m layers stay registered over the full area
- Valid coverage: NDVI / NDTI 99.7% · ET 98.6%
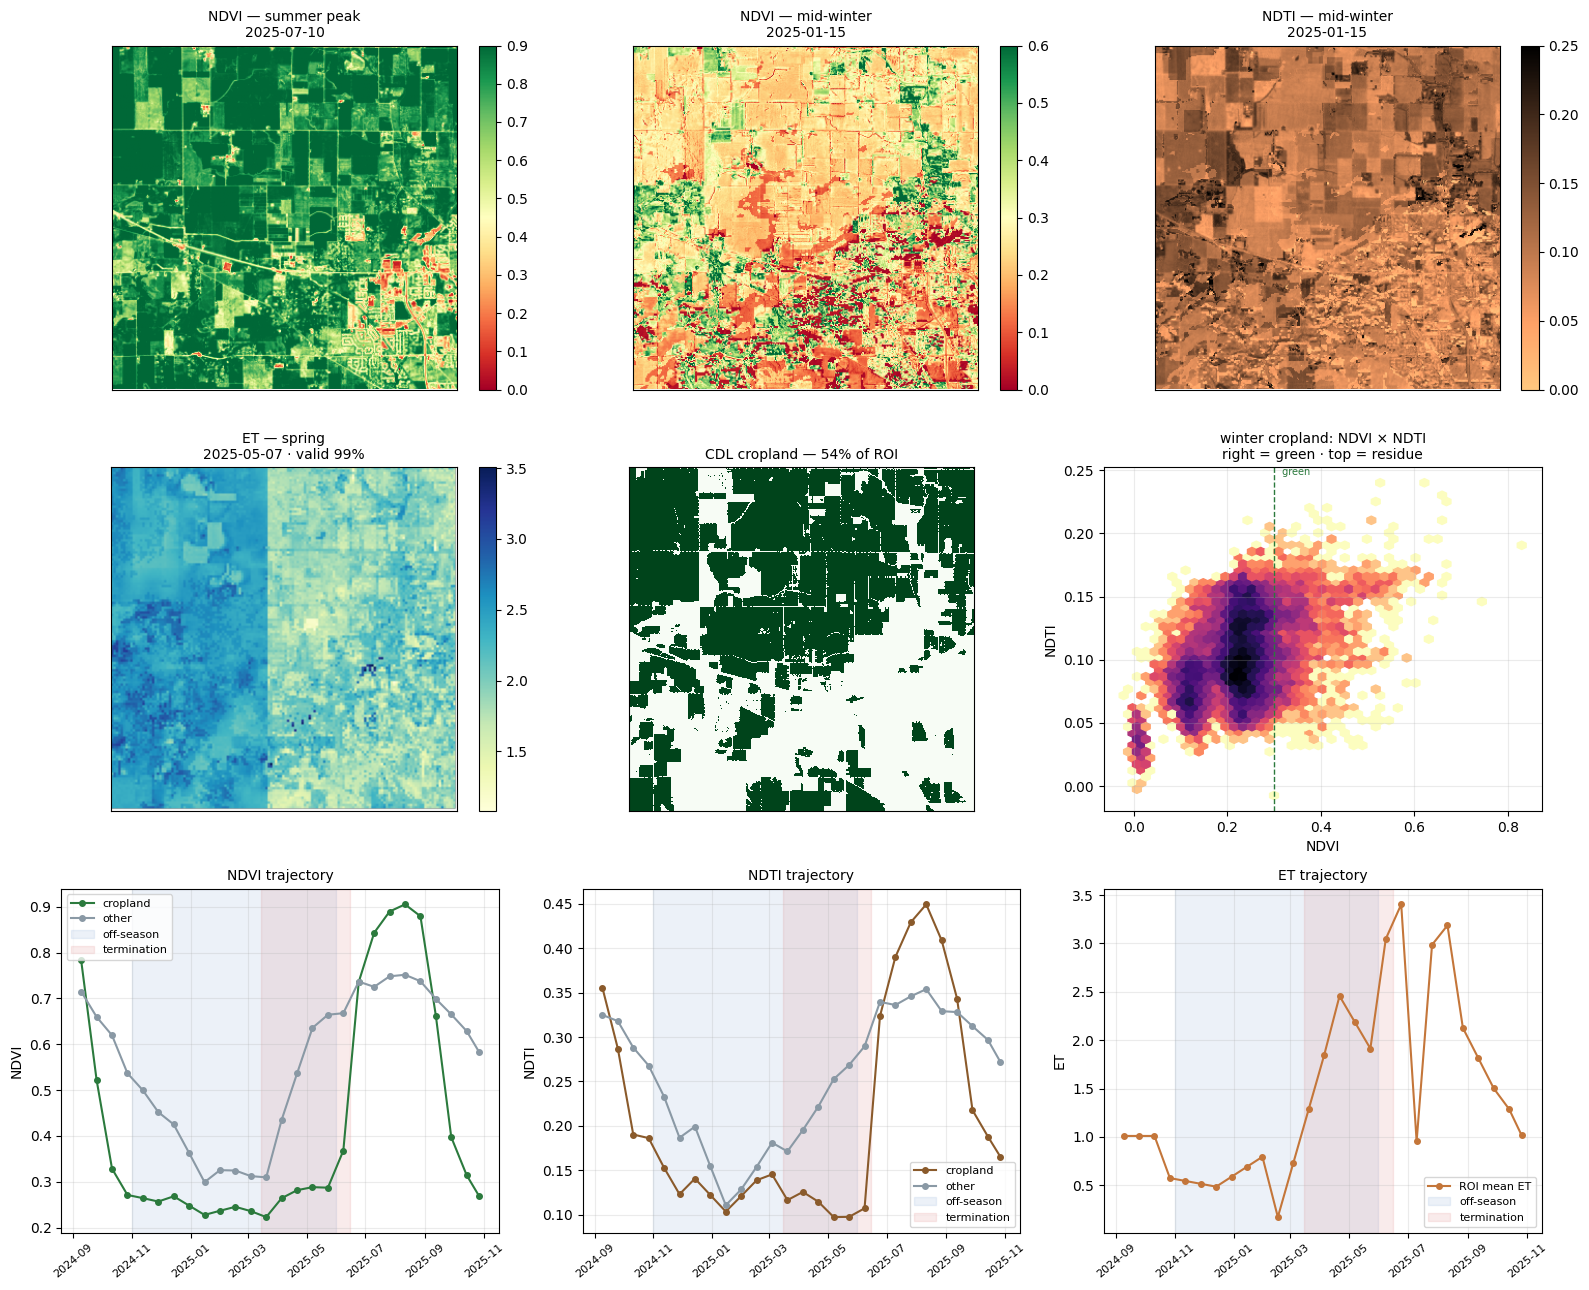
Figure 1. Fused cube QC. Top: NDVI summer peak (2025-07-10), NDVI mid-winter (2025-01-15), NDTI mid-winter. Middle: spring ET (2025-05-07), CDL cropland mask, winter NDVI × NDTI plane. Bottom: NDVI / NDTI / ET trajectories; off-season (blue) and termination window (red) shaded.
| Check | Value | Reads as |
|---|---|---|
| Summer cropland NDVI | 0.84 | healthy main crop |
| Winter cropland NDVI | 0.23 | mostly bare; green patches = candidate cover crops |
| Winter cropland NDTI | 0.10 | residue-sensitive range |
| Winter NDVI × NDTI plane | green vs. residue separate | ambiguity NDVI alone cannot resolve |
| ET trajectory | ~0 in winter, sharp rise Mar–May | thermal signal earns its place at termination |
Phenology layers for FireRX (time axis compressed to five per-pixel scalars)
| Layer | Measures | Cropland mean |
|---|---|---|
n_green |
Off-season windows with NDVI > threshold | 1.11 |
ndvi_int |
Green-days accumulated over the off-season | 0.35 |
up_slope |
Steepest spring green-up | 0.05 |
term_drop |
Sharpest drop in the termination window | 0.04 |
peak_win |
When greenness peaked (harvest → planting) | 6.6 |
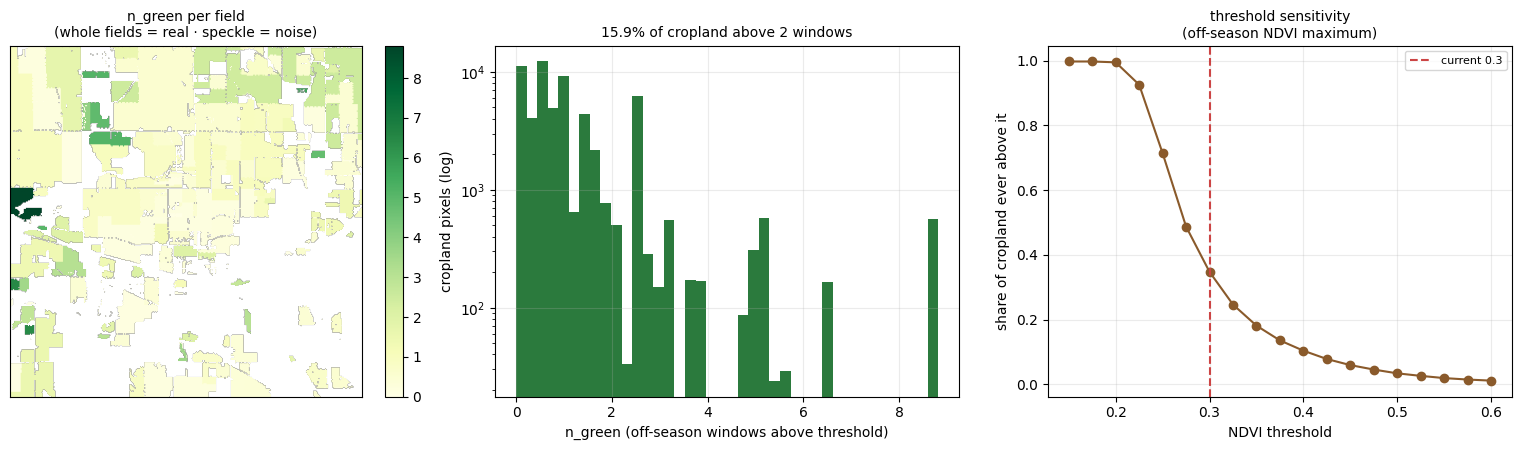
Figure 2. Layer diagnostics. Left: n_green per field (whole-field patches = real signal). Center: n_green distribution — 15.9% of cropland green for > 2 off-season windows. Right: threshold sensitivity of the off-season NDVI maximum; provisional threshold 0.30 marked.
- No redundant layers (max |r| = 0.79,
up_slope/term_drop) → all five kept - ~16% of cropland stayed green > 2 windows — plausible adoption rate for this part of Indiana
Caveats
- Greenness threshold 0.30 is provisional until labelled fields exist
- Part of the cube is interpolated, not measured; gap-filled winter windows carry less evidence
- Mid-winter ET ≈ 0 for both cover crop and bare soil — thermal is most informative Apr–May
Next
- ⬜ Export five layers as GeoTIFFs → FireRX
batch_align_raster - ⬜ Add ECOSTRESS LST with overpass-time normalisation
- ⬜ Repeat on additional ROIs before scaling to regional tiles
Progress 3 · Ground-Truth Pilot at Three Sites (in progress)
Updated 29 Sep 2026. First test of the Progress 2 layers against published field studies (tier 1). Not a model result: units are too few for one.
| Site | Source | Field-seasons | Cover crop / control |
|---|---|---|---|
| IN_PENG2025 | Indiana, own pilot fields (CCNT vs NT) | 12 | 6 / 6 |
| IL_WELCH2016_CG | Illinois, Welch 2016 | 28 | 8 / 20 |
| NE_BLANCO2017 | Nebraska, Blanco 2017 | 18 | 3 / 15 |
Each row is one field in one season; the label comes from the paper, and every unit is scored from the same fused cube and the same layers. AUC below is the chance that a cover-crop field ranks above a control field on that feature (0.5 = chance).
| Feature | IL | IN | NE |
|---|---|---|---|
ndvi_int |
0.94 | 0.58 | 0.80 |
n_green |
0.93 | 0.58 | 0.80 |
up_slope |
0.84 | 0.56 | 0.73 |
term_drop |
0.88 | 0.61 | 0.69 |
peak_win |
0.60 | 0.28 | 0.50 |
best_ndvi_rel |
0.81 | 0.86 | 0.96 |
| ET (best window) | 0.61 | 0.53 | — |
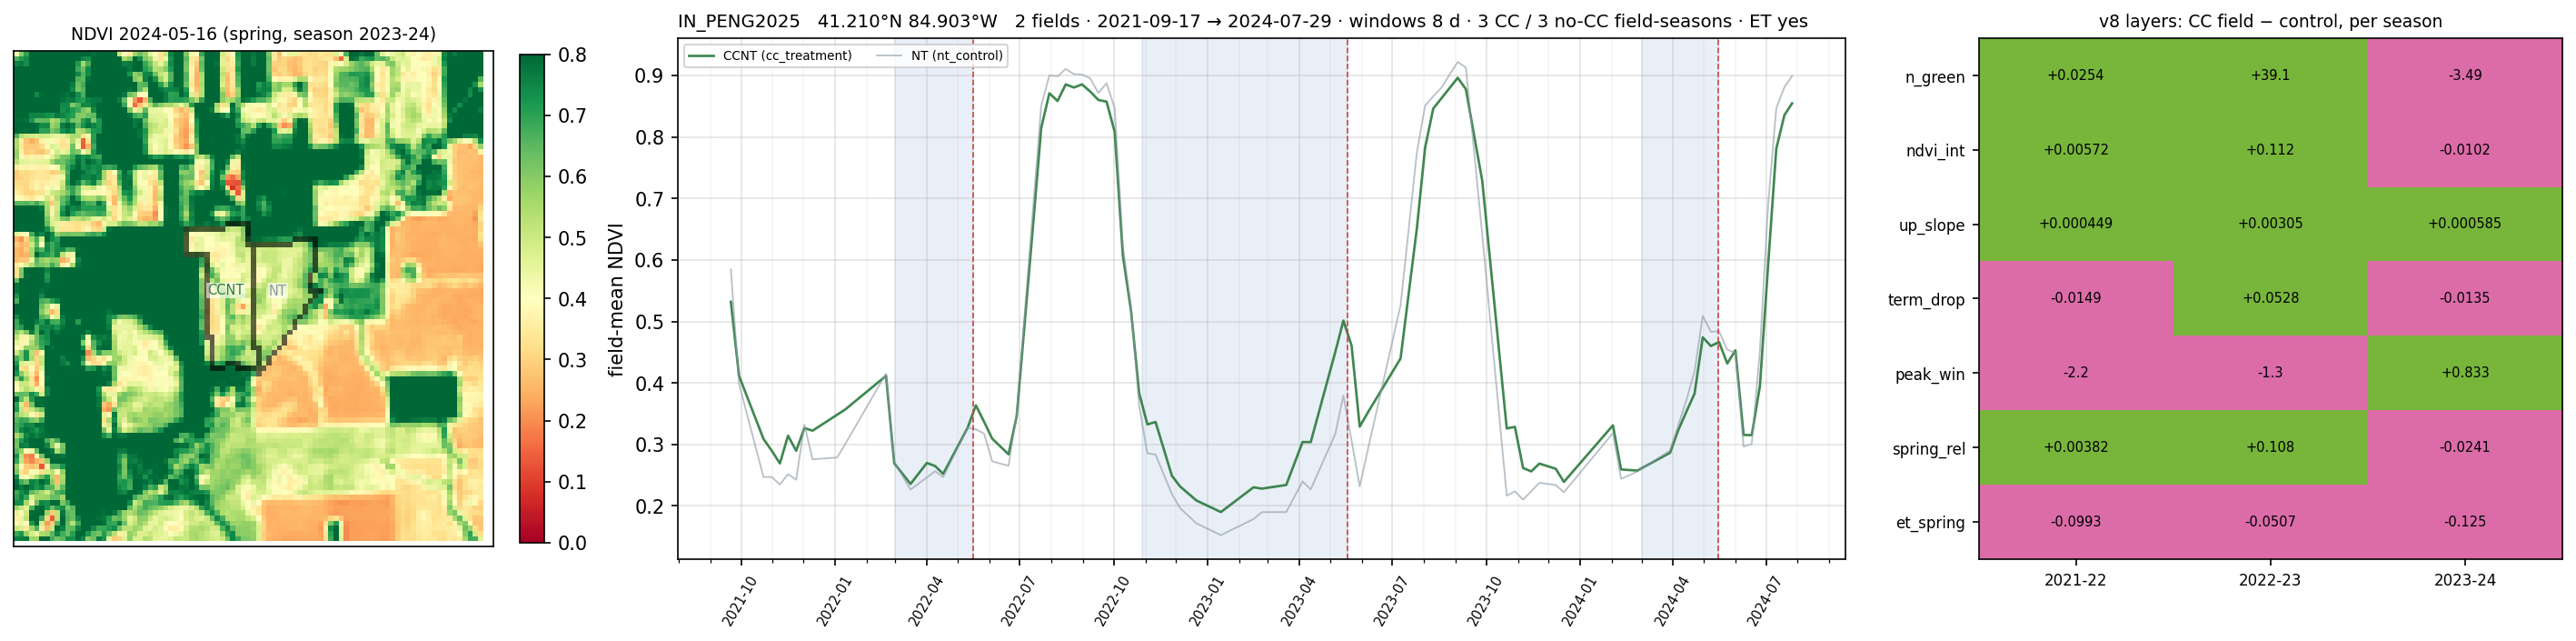
Figure 3. Indiana pilot fields (v8 run, three seasons, 8-day windows). Left: NDVI on 2024-05-16 with the cover-crop field (CCNT) and the no-cover-crop control (NT) outlined. Centre: field-mean NDVI, 2021-09 → 2024-07; blue bands = detection windows, red dashes = termination. Right: layer value in the cover-crop field minus the control, per season (green = cover crop higher, pink = lower).
Reading
- In the three seasons of Figure 3,
up_slopeis higher in the cover-crop field every season and ET in spring is lower every season;n_green,ndvi_intandspring_relare higher in two of three. - The absolute-greenness layers score AUC 0.84–0.94 at the Illinois site and 0.56–0.61 at the Indiana pilot fields.
- The relative NDVI feature (
best_ndvi_rel) is the only one above 0.8 at all three sites. Treat the numbers as provisional: NE has 3 cover-crop units and IN 12 units in total. peak_winand ET are at or below chance at IN and NE and weakest at IL → lowest priority for v11.- Caveat: IL and NE were dropped from the later Indiana-only runs (v8 onward) because their site quality was too poor, so their columns are a first pass, not evidence. Indiana is the reference site.
- Unit counts of 12–28 per site are the limit here; the Cover Crop and Tillage Transect Reports points are meant to remove it.
Progress 4 · Indiana Season Windows and Sentinel-1 (in progress)
Updated 29 Sep 2026. Same two Indiana fields; the season is split into windows and cover-crop and control values are compared on the same acquisition date.
| Season | Window | NDVI: cover crop − control | Same-day pairs, cover crop higher | Sentinel-1 VH (dB) |
|---|---|---|---|---|
| 2021-22 | spring | +0.007 | 7 / 8 | +0.08 |
| 2022-23 | corn season | −0.024 | 0 / 22 | −0.05 |
| 2022-23 | post-harvest | +0.060 | 20 / 20 | +0.49 (30 / 32) |
| 2023-24 | spring | −0.026 | 0 / 9 | −0.18 |
- The clear separation is in the post-harvest window (2022-23): cover crop is greener on every same-day pair and Sentinel-1 VH backscatter is higher. In that season the cover crop was interseeded into V-stage corn, so it is already established at harvest.
- In the two fall-drilled seasons (2021-22, 2023-24) the spring difference is ≤ 0.03 NDVI and changes sign. In the interseeded season the difference stays positive through the whole November–May window, roughly +0.03 to +0.15 (Figure 4). Detectability therefore depends on seeding method and window, not on the season alone.
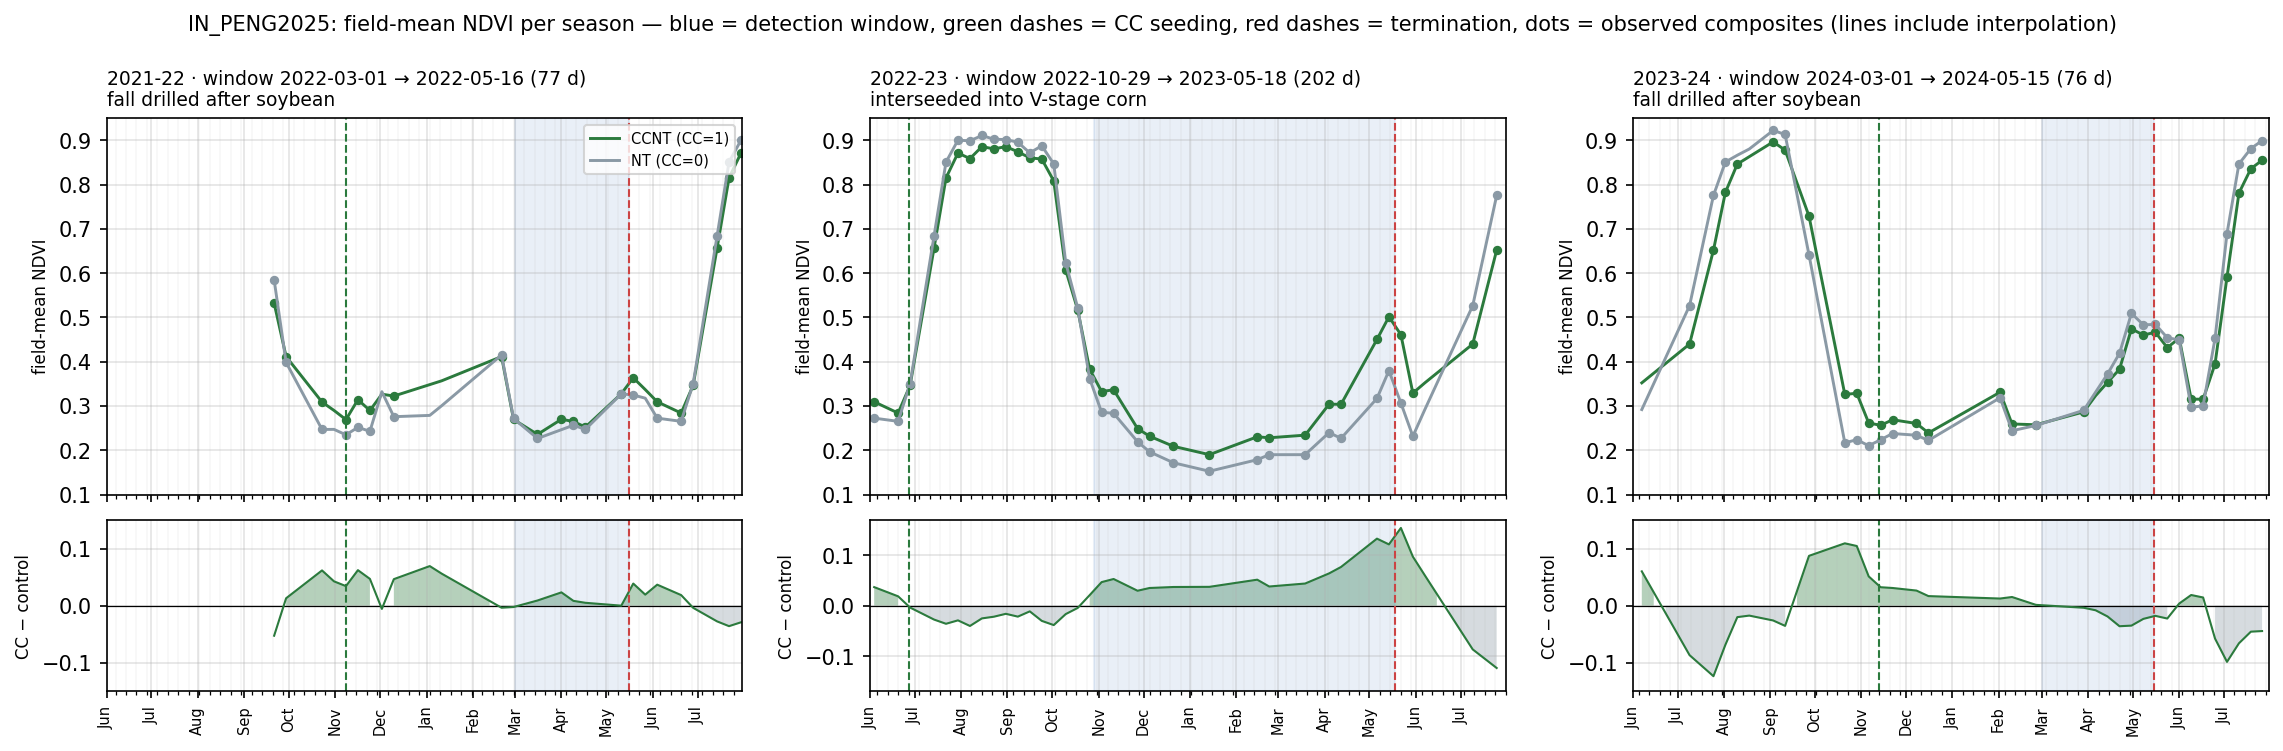
Figure 4. Field-mean NDVI per season, cover-crop field (CCNT) vs control (NT). Blue = detection window, green dashes = seeding, red dashes = termination, dots = observed composites (lines include interpolation). Bottom row: cover crop minus control. 2021-22 and 2023-24: fall drilled after soybean; 2022-23: interseeded into V-stage corn.
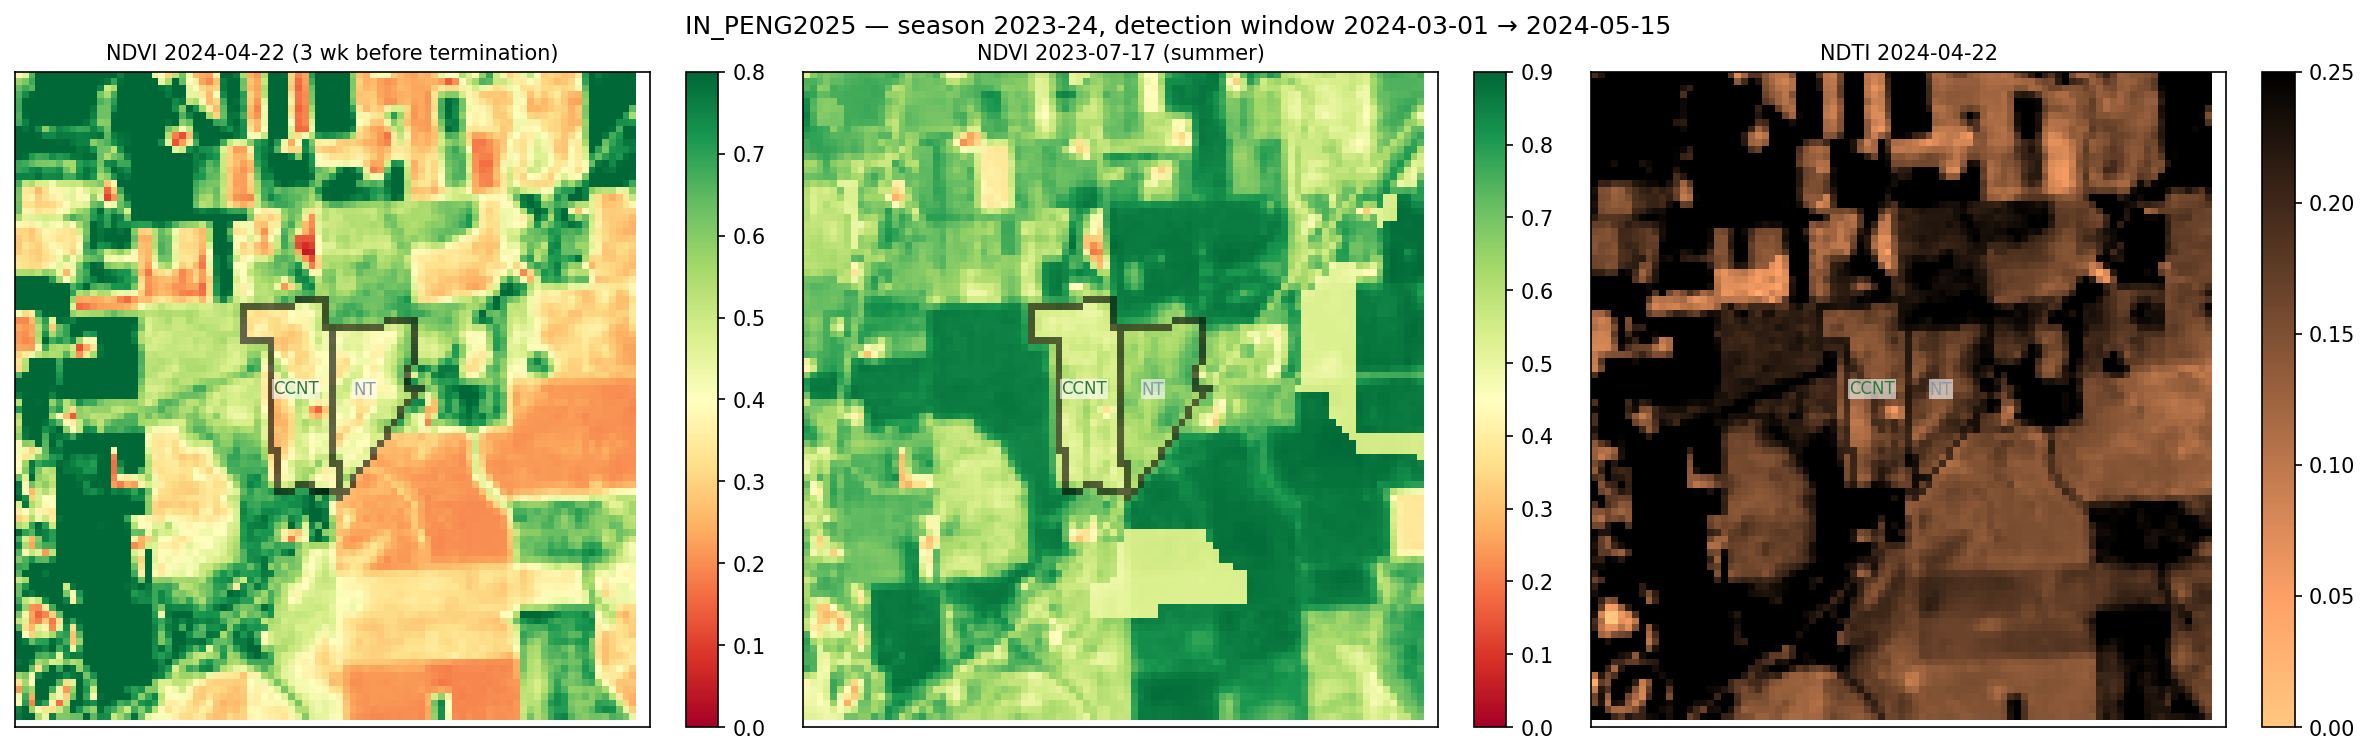
Figure 5. Season 2023-24, three weeks before termination. NDVI 2024-04-22 (left), summer NDVI 2023-07-17 (centre), NDTI 2024-04-22 (right). In this fall-drilled season the cover-crop field is not visibly greener than the control.
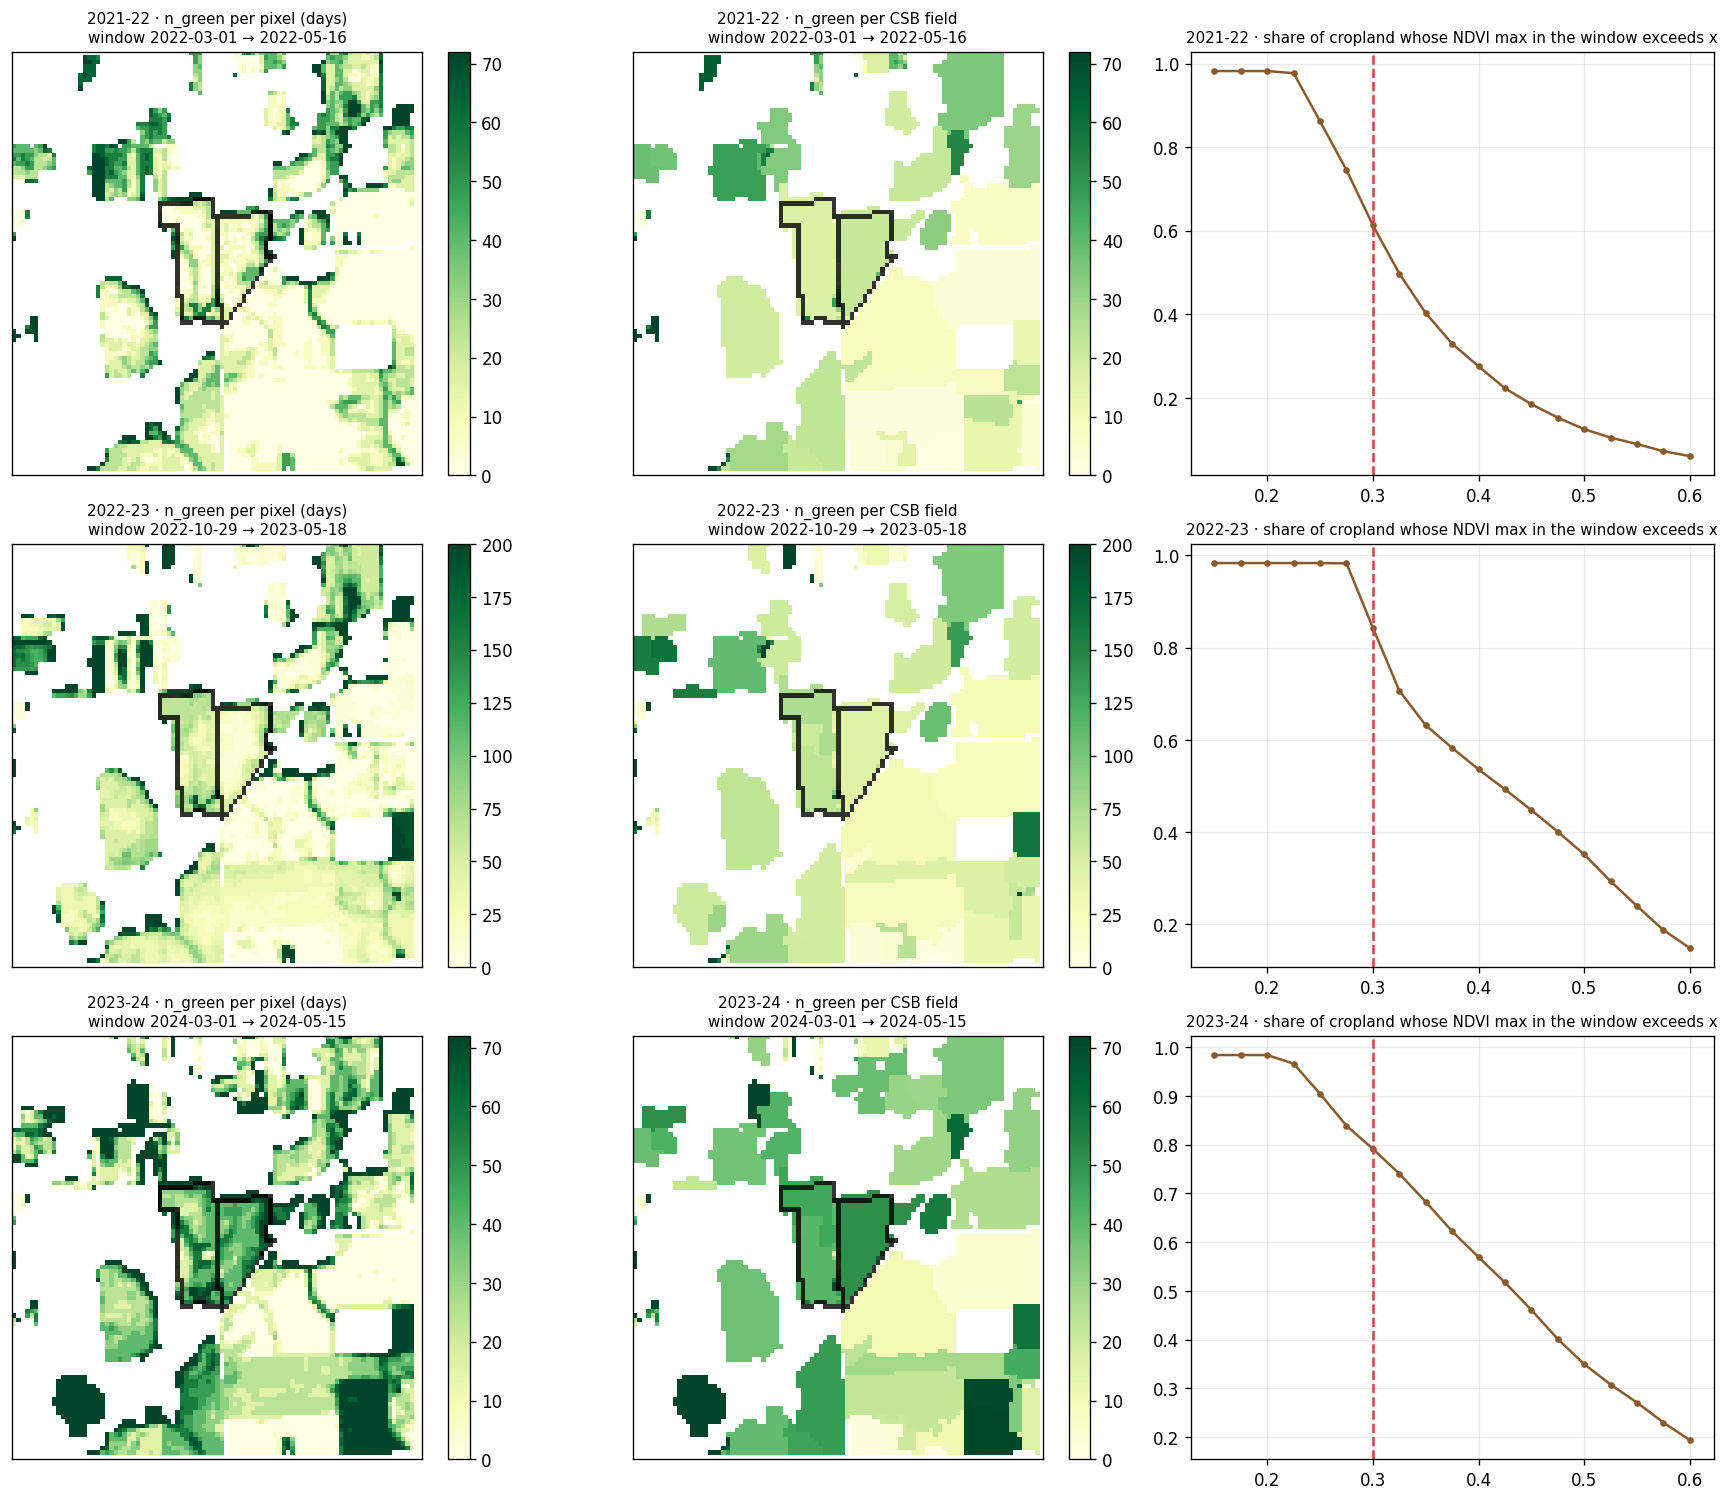
Figure 6. n_green per pixel (left) and per CSB field (centre) for each detection window, and the share of cropland whose window-maximum NDVI exceeds a threshold (right; dashed = 0.30). At 0.30 roughly 61%, 84% and 79% of cropland passes in 2021-22, 2022-23 and 2023-24 (read from the plot), so 0.30 does not separate cover crop from other green cover in spring windows; the threshold stays provisional.
- Sentinel-1 VH differs by ≤ 0.5 dB even in the best window → whether it adds to optical is a v11 stage-2 question, not a result yet.
- Next: repeat the window comparison on transect points, where each window has many more pairs.